

Apple is planning a massive iPhone 18 delay: Here’s why!
New rumors suggest that Apple is about to change how they release their phones in a very big way. For...


Latest News
ALL NEWS → US MARKETS
 Gold price drops 2% as market momentum weakens
 NEWS
NEWS US Supreme Court restores access to abortion pill mifepristone nationwide May 4, 2026
 CELEBRITY
 Charli xcx set to attend Met Gala 2026 sparks fan excitement May 4, 2026
 WORLD
WORLD Oil prices jump as UAE missile threat warning shakes global markets May 4, 2026
 WORLD
WORLD 61% Americans call Iran war a mistake as public opinion turns faster than Iraq and Vietnam
A new survey by ABC News and The Washington Post has revealed a strong shift in opinion.Around 61%…
May 2, 2026


US Job openings take a surprising dip as economic uncertainty grows 7 hrs ago


May 4, 2026


 TECH
TECH OpenAI raises $4 billion to push AI into businesses worldwide
Artificial intelligence is no longer just a tech buzzword. It is becoming a real business tool. And now, one of...
May 4, 2026


US market price today, May 4: Nasdaq gains 0.11% while Dow Jones falls 0.43% May 4, 2026

Agriculture commodities price today, May 4: Tea spikes 16.39% in a day while potatoes explode 704.35% monthly May 4, 2026

Metal prices today, May 4: Silver jumps 126.85% YoY while lithium surges 163.79% and gold holds 36.93% May 4, 2026

Energy prices today, May 4: Gasoline surges 111.52% YTD and Brent climbs 84.30% YoY May 4, 2026


GOG launches giveaway of four classic games, free until May 2026 May 2, 2026

PS5 refurbished price hike shocks gamers as Sony raises console costs again May 2, 2026

Fortnite adds Clone Wars Anakin and Ahsoka as Star Wars hype returns to peak fan demand Apr 29, 2026

Far Cry series update as Noah Hawley rejects game story adaptation approach Apr 24, 2026

NASA’s Artemis II astronauts splash down safely after historic Lunar Mission Apr 11, 2026
Lifestyle
MORE →
Casper the Friendly Ghost live action series in development at Disney Plus Apr 29, 2026

Coachella 2026 salaries shock fans as Justin Bieber beats Sabrina Carpenter by a huge margin Apr 18, 2026

The role of speculative positions in Brent Crude volatility Apr 11, 2026

The impact of global news on oil trading decisions Apr 11, 2026

Why Brent Crude is used for inflation hedging Apr 11, 2026

Why Brent Crude is linked to strategic reserves Apr 11, 2026

Sports
MORE →
FIFA overhauls disciplinary regulations for 2026 World Cup to prevent player suspensions Apr 29, 2026

NFL media deals under scrutiny as Justice Department probes sports shift to streaming and ad revenue impact Apr 23, 2026

Ulberg claims UFC light heavyweight title with stunning first-round KO in front of Trump Apr 12, 2026


Heart Eyes 2 confirmed as horror romcom hit locks Valentine 2028 release
One of the most unexpected horror successes of recent times is coming back. Heart Eyes is officially getting a sequel,...
May 3, 2026
Solo Leveling season 3 set to explode as Jinwoo Black Heart transformation takes over May 3, 2026

Berserk of Gluttony Season 2: Release date speculation, cast and plot details – Everything we know so far May 3, 2026

Danmachi Season 6: Release date speculation, cast and plot details – Everything we know so far May 3, 2026

Saga of Tanya the Evil Season 2: Release date speculation, cast and plot details – Everything we know so far May 3, 2026

The Way Home Season 4: Latest updates on release date, cast news and plot details May 3, 2026

Michael Jackson songs rule Spotify again as Billie Jean and Beat It hit Global Top 5 May 3, 2026
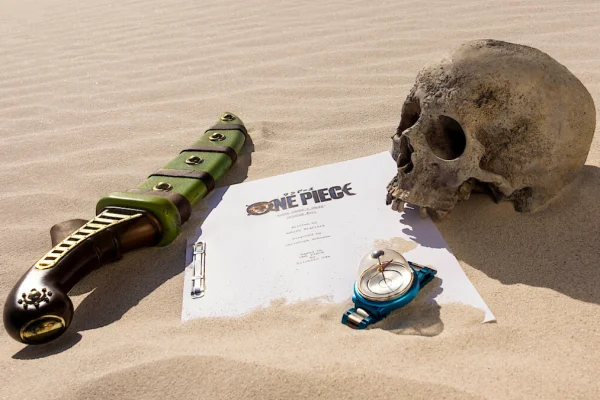
Netflix’s One Piece Season 3: Latest updates on release date, cast news and plot details May 3, 2026