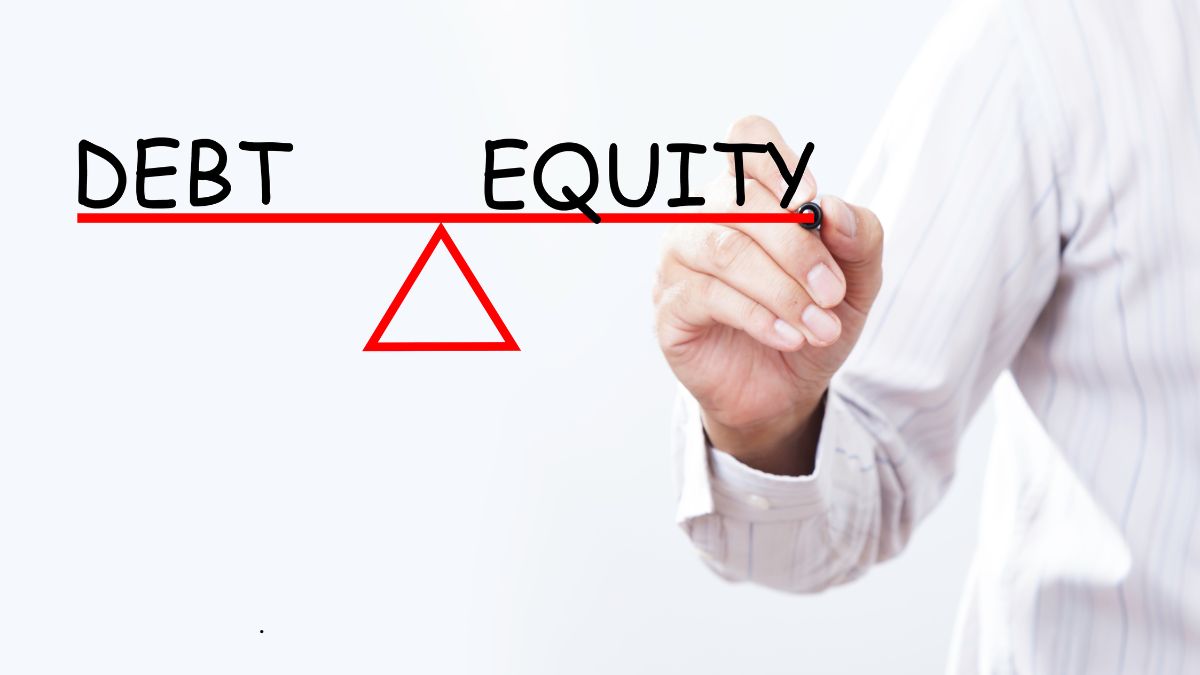
When analyzing a company’s financial health, one of the first things investors and analysts check is its debt-to-equity ratio (D/E ratio).
This ratio helps answer a basic but critical question:
How much debt is the company using compared to shareholder equity to finance its operations?
What is the debt-to-equity ratio?
Formula:
Debt-to-equity ratio = Total Debt / Shareholders’ Equity
It shows how much debt a company has for every rupee of equity.
For example:
If a company has Rs 100 crore in debt and Rs 200 crore in equity, its debt-to-equity ratio is:
100 ÷ 200 = 0.5
This means:
For every Re 1 of shareholder capital, the company has 50 paise of debt.
Why is this ratio important?
- Measures financial risk
A higher D/E ratio means the company is more dependent on borrowed money. This makes it riskier, especially in times of high interest rates or economic downturns. - Shows capital structure
It helps investors understand how a company finances its assets – through debt or equity. - Bankruptcy risk indicator
Excessive debt increases the chance of default or bankruptcy. - Affects profitability
Debt brings interest costs. Higher debt means more fixed payments, affecting net profit.
What is a good debt-to-equity ratio?
It depends on the industry:
| Industry | Typical D/E Ratio Range |
|---|---|
| IT Services, FMCG | 0 to 0.5 (Low debt preferred) |
| Manufacturing, Auto | 0.5 to 1.5 (Moderate debt common) |
| Infrastructure, Real Estate | 1.5 and above (High debt often used) |
Key point:
A ratio above 2 is generally considered risky for most industries, but acceptable in infrastructure or capital-intensive sectors.
Real-life example:
| Company | Total Debt (Rs crore) | Shareholders’ Equity (Rs crore) | Debt-to-Equity Ratio |
|---|---|---|---|
| HUL (FMCG) | 1,000 | 9,000 | 0.11 |
| Tata Motors (Auto) | 70,000 | 35,000 | 2.0 |
| NTPC (Power) | 1,50,000 | 1,00,000 | 1.5 |
- HUL runs with almost no debt.
- Tata Motors uses heavy debt due to its manufacturing and capital needs.
- NTPC, being in power infrastructure, operates with a higher but manageable debt load.
Pros of having some debt:
- Leverages growth (if the business earns more than the debt cost)
- Lowers weighted average cost of capital (WACC)
- Provides tax shield (interest on debt is tax-deductible)
Risks of high debt:
- Interest burden eats into profits
- Higher risk of bankruptcy in bad times
- Less flexibility for future funding
Important variations:
- Net debt-to-equity:
Takes cash reserves into account:
(Total Debt – Cash) / Equity - Long-term debt-to-equity:
Focuses only on long-term borrowings, ignoring short-term debt.
When analyzing D/E ratio, always check:
- Industry averages
- Company’s earnings stability
- Interest coverage ratio (Can the company pay interest comfortably?)
- Recent debt repayment trends
Final takeaway:
The debt-to-equity ratio is one of the clearest indicators of a company’s financial leverage and risk. Investors should compare this ratio with peers in the same industry and track its trend over time. A rising D/E ratio with stagnant profits is often a red flag.


